Barley Market Report: 2023 Barley Acreage Projections and Key Factors Influencing Supply and Demand”
How Many Barley Acres Are Needed?
Even though most seeding plans are finalized by this time of year, there are still plenty of ideas about seeded area for 2023. StatsCan will issue its first estimate of seeding intentions April 26, but that won’t be the final word. We have our own guesstimates and other companies have their sets of numbers as part of their planning processes. We have access to a few of those but there are many others we don’t see.
It’s interesting how some people are very convinced they have the right acreage numbers but in reality, there’s always a certain amount of guesswork in forecasting seeded area. There’s a bit of “art” to go along with the science. Because of this uncertainty, we like to compare a few estimates of this spring’s barley acreage to see how they could affect the outlook for 2023/24.
The range of estimates (that we’ve seen) of 2023 barley acreage is fairly narrow, from a low end of 7.0 mln to the high end at 7.6 mln acres. For reference, seeded area was 7.0 mln acres in 2022 and over the past five years, has ranged from 6.5 to 8.3 mln acres. This suggests that if 2023 barley area ends up in this range of 7.0-7.6 mln acres, there shouldn’t be large shifts in the supply side as long as western Canadian weather is close to “normal”.
At this very early stage of the year before the crop is in the ground, the best odds for a yield guess is somewhere close to average. We are using an “olympic” average (the last five years after dropping the high and the low) of 68.7 bu/acre, down from 70.4 bu/acre in 2022. The result would be a 2023 barley crop ranging from 9.4 to 10.2 mln tonnes, close to the 10.0 mln tonnes from 2022.

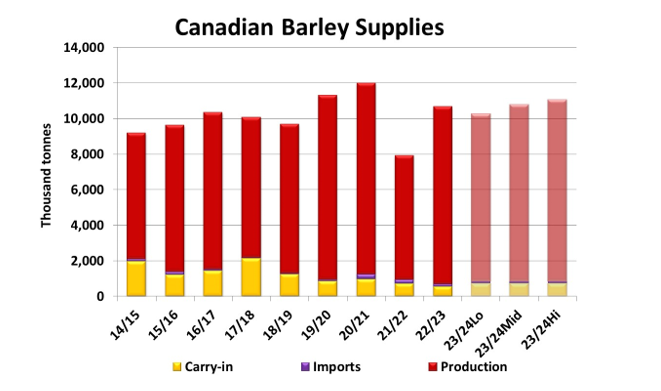
Again, this steady production points to a supply side very similar to the current year. Carryover stocks from 2022/23 into next year will only be marginally larger than they were a year ago, keeping supplies quite stable. These estimates point to 2023/24 barley supplies ranging from 10.3 to 11.1 mln tonnes, on either side of 2022/23 at 10.7 mln tonnes.
If supplies don’t change much next year, the 2023/24 barley outlook will be more influenced by the demand side of the balance sheet. The chart shows that on the surface, barley supplies look fairly comfortable compared to the last 10 years but that’s relative, largely depending on the level of demand.
Domestic feed use is the largest part of Canadian barley usage. While livestock numbers don’t change much from year to year, barley’s share of that market can vary due to availability of other feedgrains like feed wheat and corn. Overall though, we would expect barley feed use to remain fairly flat. The other part of domestic barley use is malting, and there have been signs this consumption is declining.
Even though exports aren’t the largest part of Canadian barley use, volumes can be quite variable. Over the last five years (excluding the 2021/22 drought year), exports have ranged from 2.2 to 3.5 mln tonnes. China is the dominant destination for Canadian barley, accounting for 85-90% of the total. Canadian exports to China have benefitted in recent years due to reduced barley availability from competing exporters. That situation may not last, which adds some risk to the outlook.
Of course, all these acreage estimates won’t mean much if yields are a lot different than the average. A change of two or three bushels per acre can offset quite a few acres, either higher or lower. Clearly, the acreage estimates shown above aren’t the last word on the 2023/24 market outlook.


